
Integrated Financial Dashboard
Gain real-time visibility into your business's financial health. Monitor payments, receivables, and key metrics from a single, customizable interface designed for informed decision-making.
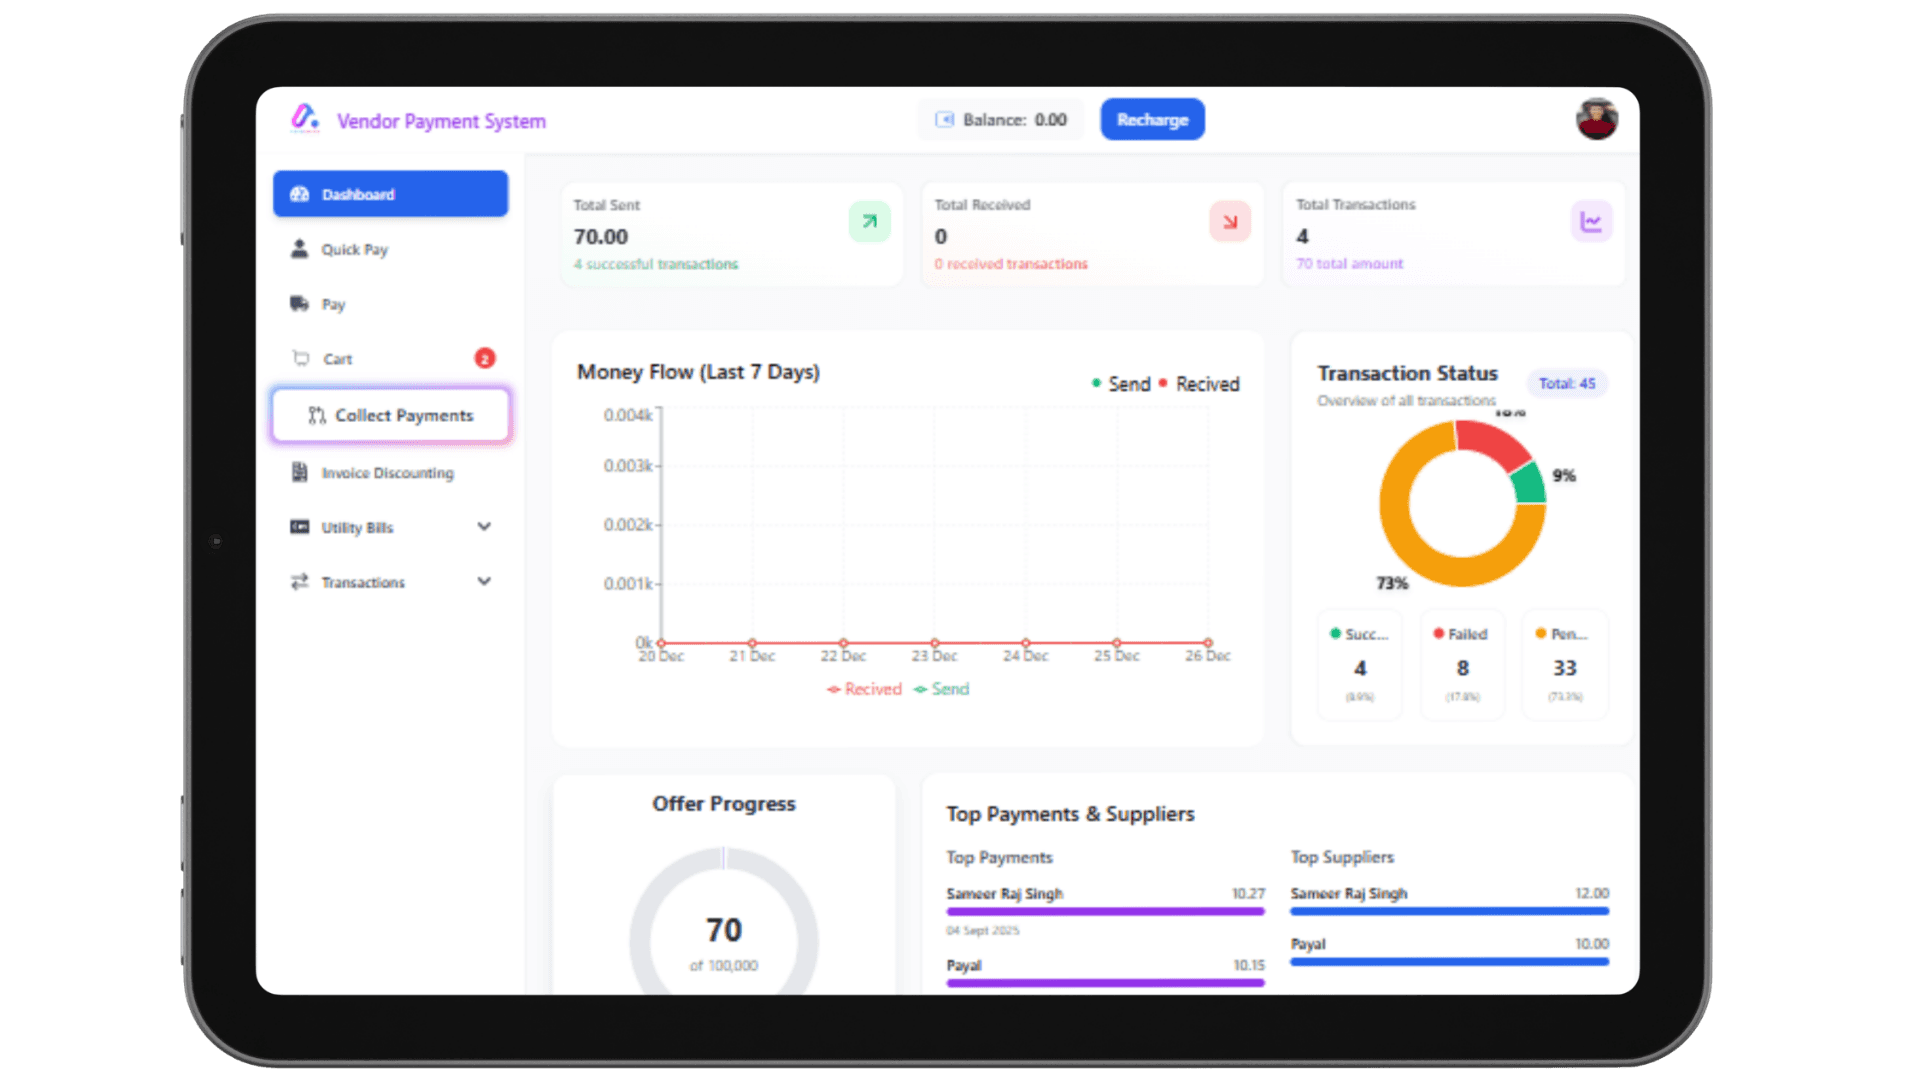
Unified View
Consolidate all financial data — payments, receivables, cash flow — into one intuitive dashboard.
Real-Time Insights
Access up-to-the-minute financial information to make timely decisions.
Customizable Indicators
Tailor early warning signals to your business needs, helping you anticipate and address potential issues proactively.
Why Finigenie
Built to give you total financial control
Five ways Finigenie helps your finance team move faster, catch problems earlier, and make better decisions.
All-in-One Financial Snapshot
Monitor cash flow, expenses, and revenue streams in real time, ensuring a holistic understanding of your financial position. Get a bird's-eye view of your company's financial activity across accounts, departments, and locations.
Custom Early Warning Indicators
Get personalized alerts for receivables, spending anomalies, or liquidity concerns, enabling swift action. These proactive nudges help prevent issues before they affect your bottom line.

Seamless Integration
Connect with existing accounting and ERP systems for automatic data synchronization and reduced manual entry. Keep your financial ecosystem clean, connected, and up to date without duplication.

Interactive Data Visualization
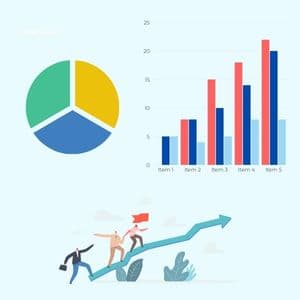
Use charts and graphs to identify trends, compare periods, and forecast future financial scenarios. Drill down into any metric to uncover what's driving the numbers behind the surface.

Role-Based Access Control
Ensure team members only see the data relevant to their responsibilities, maintaining data security and adherence. Finance, operations, and leadership teams each get access insight tailored to their decision-making needs.

Business Impact
What are the benefits for your business
Enhanced Decision-Making
Leverage comprehensive data to make informed strategic choices.
Proactive Risk Management
Identify and mitigate financial risks before they escalate.
Operational Efficiency
Reduce time spent on manual reporting and data reconciliation.
Improved Cash Flow Management
Keep a closer eye on receivables and payables to maintain healthy liquidity.
Stakeholder Confidence
Provide transparent and accurate financial reports to investors and partners.
Got Questions?
Everything you need to know about Finigenie. Can't find the answer? Talk to our team.
It is an enterprise financial operating system that consolidates bank accounts, receivables, payables, and ERP ledgers into one real-time dashboard. Autonomous AI agents handle transaction classification, anomaly detection, cash flow forecasting, and automated compliance.
The dashboard integrates natively with Tally, Zoho Books, SAP, Oracle NetSuite, QuickBooks, and custom ERPs via bidirectional REST APIs and real-time webhooks, taking less than 7 days to deploy.
Finigenie analyzes historical payables, customer collection patterns, recurring vendor obligations, and seasonality using predictive machine learning models to forecast enterprise cash runway and liquidity 30, 60, and 90 days out.
Yes. Finance teams managing legal entities across India, UAE, and global trade corridors can switch between consolidated group views or single-entity drilldowns with automated FX translation and intercompany eliminations.
Our agentic AI matches invoices against purchase orders and banking histories before releasing disbursements. It flags duplicate invoices, altered beneficiary bank details, and suspicious payment velocity in real time.
The platform offers granular Role-Based Access Control (RBAC). CFOs and directors have full multi-entity oversight and approval authority, while accountants, procurement leads, and auditors have strictly partitioned view-only or workflow-restricted access.
Calculate Your ROI
Make informed investment decisions with our advanced ROI calculator.

Calculate Your ROI
Make informed investment decisions with our advanced ROI calculator.